The Dashboard, accessed through the Dashboard command in the Command Center's main menu, provides an overview of the state of current surveying (project) activities. The 'Show all' option in the ![]() button allows you to see all projects whether active or not.
button allows you to see all projects whether active or not.
It comprises several views: Project View, Interviewer View, Quotas View and CAPI view (if enabled), activated by their respective buttons. These views are configurable through the Preferences command in the Command Center main menu.
Note: The Dashboard can also be accessed directly via its URL: http://ipaddress/voxco.web
The Project View is a consolidated display of the status and progress of ongoing active (project) collection modules, together with buttons providing quick access to tools for managing the one currently selected in the list:
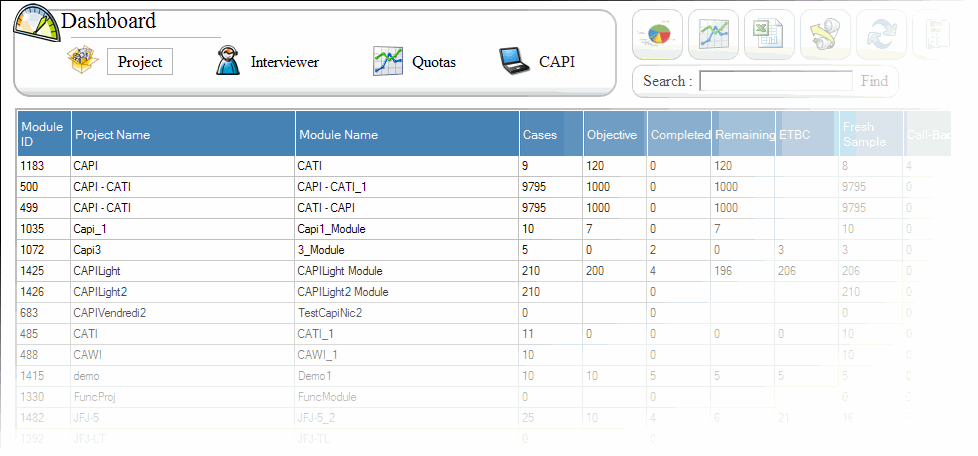
To access Field management tools for a project
Do one of the following:
In the Dashboard project list, select (highlight) the desired project's collection module and then click on the appropriate (toolbar) icon.
Double-click the desired project's collection module in the project list. This will open up the project's Display Page; from there you can access the Field tools.
To access a project which does not appear in the Projects List
Note: Only active project modules are displayed in the Projects List
Do one of the following:
Click on the Navigation button in the main menu, and then navigate to the project in the Navigation Tree.
Click on the Management button in the main menu. The green Navigation bar will appear positioned at the root of your context, from there you can then navigate to the project in the Folders view.
To configure the columns
From the Command Center's main menu select Preferences.
In the Preferences page select Dashboard. This opens the Dashboard configuration page.
The 'Dashboard name' drop-down list must have 'Dashboard by project' selected. When you click on the Accept button, the Default columns list will offer for selection 20 different statistics:
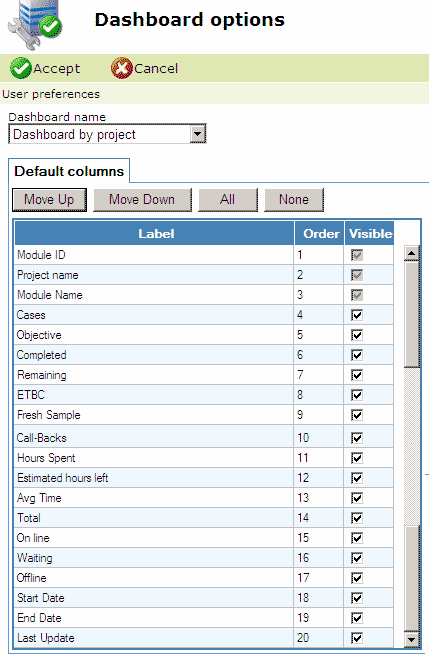
To include a statistic (column in the Dashboard) simply choose it by means of its check-box. You can position any column in the list by selecting it, and then moving it up and down the list using the Move Up and Move Down buttons.
|
Column |
Description |
|
Module Id. |
Resource identification number of the Collection Module on the Directory Server |
|
Project name |
Project Name |
|
Module Name |
The name of the Collection Module |
|
Cases |
Number of cases in the database accessed by the project |
|
Objective |
Global quota set for the project |
|
Completed |
Number of completed cases for the project i.e. those that reached the Completion Question in the questionnaire defined for the collection module. |
|
Remaining |
Additional number of completed cases needed to attain the Objective (global quota). |
|
ETBC |
Estimated Time Before Completion Formula: Completed divided by (Cases-Fresh Sample-Call-backs)*(Fresh sample+Call-backs) |
|
Fresh sample |
Number of cases in the database which have not yet been touched |
|
Call-backs |
Number of cases to be called back. |
|
Hours Spent |
The sum of all durations that cases (records) have been open on interviewer/respondent screens. |
|
Estimated hours left |
Formula: Remaining*Hours Spent/Completed cases |
|
Average Time/Completed |
Time spent to achieve a completed case. Formula: Spent Hours divided by Completed (see above). NB: Bears no relationship to the average time spent on each completed case. |
|
Total (assigned Users) |
Number of users assigned to the collection module |
|
On-line interviewers |
Number of interviewers (cases) currently being processed |
|
Waiting interviewers |
Number of interviewers currently waiting for a connected call |
|
Off-line interviewers |
Total (assigned) users minus interviewers who are on-line or waiting for a call. |
|
Start Date |
Start Date specified in the project's call-back Calendar |
|
End-Date |
End Date specified in the project's call-back Calendar |
|
Last Update |
The date of the last modification made to the project |
The Interviewer View is a consolidated overview of the performance statistics of the interviewers (agents, users) currently on-line, starting from the beginning of their sessions. It includes buttons for exporting the list to Excel, for refreshing the display, and for searching for a particular interviewer:

To configure the default columns
From the Command Center's main menu select Preferences.
In the Preferences page select Dashboard. This opens the Dashboard configuration page.
The 'Dashboard name' drop-down list must have 'Dashboard by Interviewer (Agent)' selected.
When you click on the Accept button, the tab titled Default columns list will offer for selection 7 different statistics.
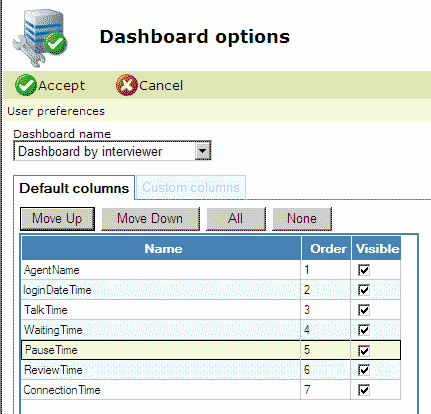
To include a statistic (column in the Dashboard) simply choose it by means of its check-box. You can position any column in the list by selecting it, and then moving it up and down the list using the Move Up and Move Down buttons.
|
Column |
Description |
|
Agent Name |
The interviewer's name. |
|
Login Date/Time |
The date and time that the interviewer logged into the project. |
|
Talk Time |
Sum of durations during which cases are open on the interviewer's screen. |
|
Waiting Time |
Sum of durations between closing a case and receiving a new call from Pronto. |
|
Pause Time |
Sum of durations between closing a case and the interviewer requesting another one. |
|
Review Time |
Currently not calculated. The sum of durations spent by the interviewer in reviewing a case i.e. opening and closing it outside the interviewing process. |
|
Connection Time |
The difference between Login and Logout time minus any time that may elapse between closing the last case and logging out. |
Note: Connection time is updated in real-time. Talk, Waiting, Pause and Review Times, however, are only updated at the end of an interview; the same applies to any custom column whose computation is based on them (see below).
To configure Custom columns
You can, optionally, create your own Custom columns. Note: they are always displayed in the Dashboard to the right of the Default columns.
From the Command Center's main menu select Preferences.
In the Preferences page select Dashboard. This opens the Dashboard configuration page.
The 'Dashboard name' drop-down list must have 'Dashboard by Interviewer (Agent)' selected.
Click on 'Custom columns' tab; the column configuration area will appear. The section on the left is used for defining the column's value (formula); the section on the right is used for giving the currently selected column its name, in as many languages as required:
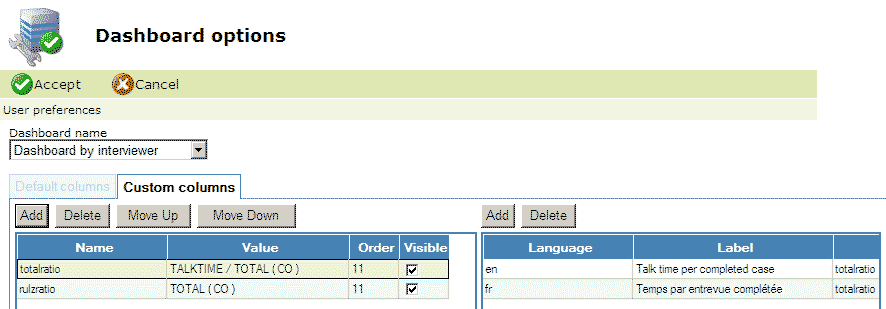
Use the Add button to add a new custom column (it will appear as a new row in the list).
To give the column a name, first select it, and then edit its name in name appropriate language in the right-hand list. You can Add and Delete languages using the corresponding buttons provided.
Double-click in the Value column to define the formula. The syntax is described below.
You can use the Move Up and Move Down buttons to change the presentation order of these custom columns. Each one can be suppressed from the display by unchecking the 'Visible' check-box.
Notes:
The Interviewer view displays all custom columns configured by all users.
A custom column, however, can only be deleted by the user who created it. Hence, it is important for users to collaborate so as to avoid creating redundant columns.
The formula for the value displayed in a column can use the default column variables Talktime, Waitingtime, Pausetime, Reviewtime and Connectiontime together with arithmetic operators. Note that there are no spaces in the variable names. You can also obtain counts of disposition codes (call results) using the function TOTAL (code1, code2, code3....) where code represents any INT code for the project.
Example
To compute the average interviewing time by completed case, we might create this formula, where the call result for a complete case is CO:
(TALKTIME+REVIEWTIME)/TOTAL(CO)
The format of a custom column is determined from its name ending:
A name finishing in 'date' or 'datetime' is displayed in date format
A name finishing in 'time' is displayed in time format
A name finishing in 'ratio' is displayed as fraction to 2 decimal places
Other names are displayed 'as-is'.
The Quotas View is a consolidated overview of the progress of projects from the point of view strata/quotas. The layout is identical to the Strata/Quotas screen of a single project but its content consists of a customized selection of strata from one or more selected projects.
To select strata
From the Command Center's main menu select Preferences.
In the Preferences page select Dashboard. This opens the Dashboard configuration page.
The 'Dashboard name' drop-down list must have 'Dashboard by Quotas' selected. The strata selection tables will be displayed:
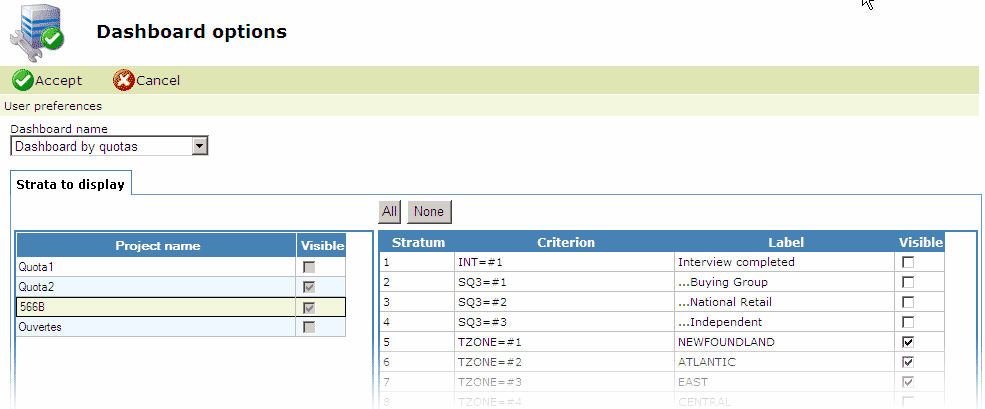
Select a project in the left-hand list. Its strata will be displayed in the right-hand list.
In the right-hand list, use the 'Visible' check-boxes to select the strata that you wish to be displayed.
Repeat steps 4-5 as many times as necessary.
When you have made all of your selections, click on the Accept button.
|
Button |
|
Description |
|
|
Opens a pie-chart display of the state of sample for the project currently selected in the table. |
|
|
|
Opens the Quotas Definition page for the project currently selected in the table. |
|
|
|
Opens the Call-backs Assignment page for the project currently selected in the table. |
|
|
|
Export to Excel |
Exports the Dashboard table to Excel. |
|
|
Refresh |
Refreshes the dashboard table to reflect the current contents of the database. Note: The dashboard table is not refreshed automatically. |
|
|
Calculate |
For the project currently selected in the table, recalculates all the project's statistics in the database, and refreshes the dashboard table. |
The display, primarily aimed at CATI collection projects, is divided into two pie-charts:
Sample Distribution. Presents the state of all the sample regardless of whether any of it may be in Strata (quota cells) that are currently closed.
|
Sample State |
Description |
|
Fresh |
Cases which have never been called (touched) |
|
Passed call-backs |
Cases which are in call-back state, and whose scheduled call-back time has already passed. |
|
Unavailable |
Cases which have been called (touched), and have been withdraw from the Field i.e. which are not in call-back state. |
|
Call-backs to come |
Cases which are in call-back state, but whose scheduled call-back time has not yet arrived. |
|
Completed |
Cases whose completion question has been reached. |
Sample Availability. Presents the state of all sample that is currently available to be called against all the remaining sample.